
Email analytics insights don’t just help you track email performance, they also are a powerful tool to help you improve your email campaigns. It’s simple: If you know what clients and devices your audience uses to read your email, you can focus your design and optimization efforts on exactly these environments. That means a better experience for your subscribers—and a more efficient process for your team.
Over the course of 2017, we analyzed 15 billion email opens to see where subscribers read emails, and summarized our findings in our 2017 Email Client Market Share infographic. But what has changed in 2018? Here’s what the first six months’ worth of Email Analytics data—that’s insights from more than 6 billion email opens tracked with Litmus Email Analytics—teach us about the email marketing landscape.
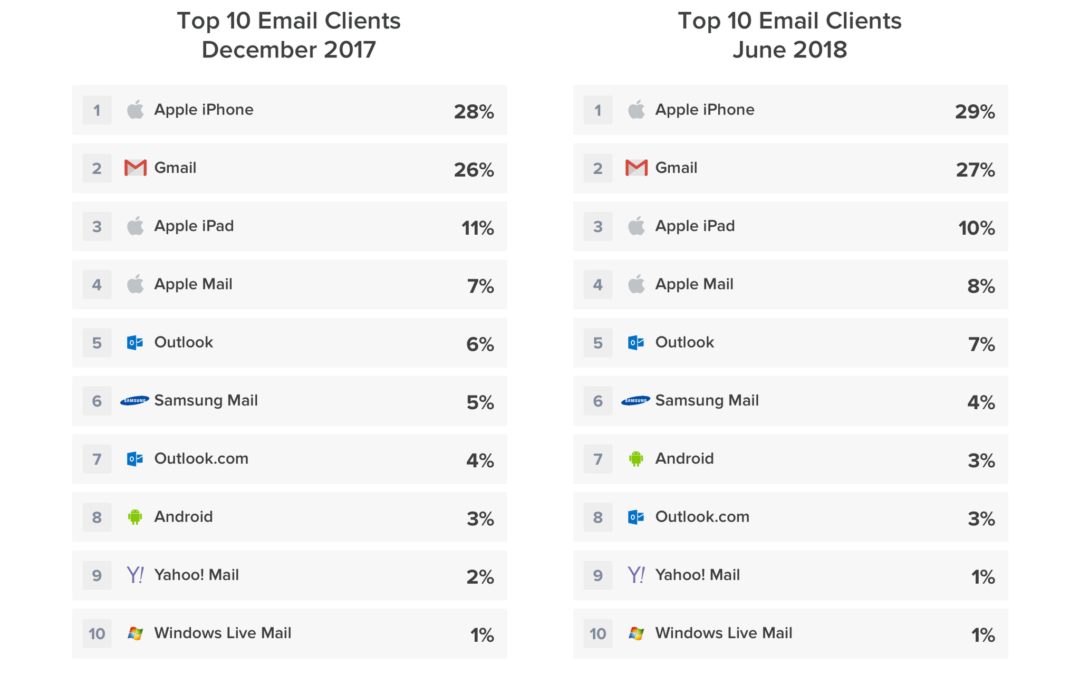
The top 10 email clients remain the same
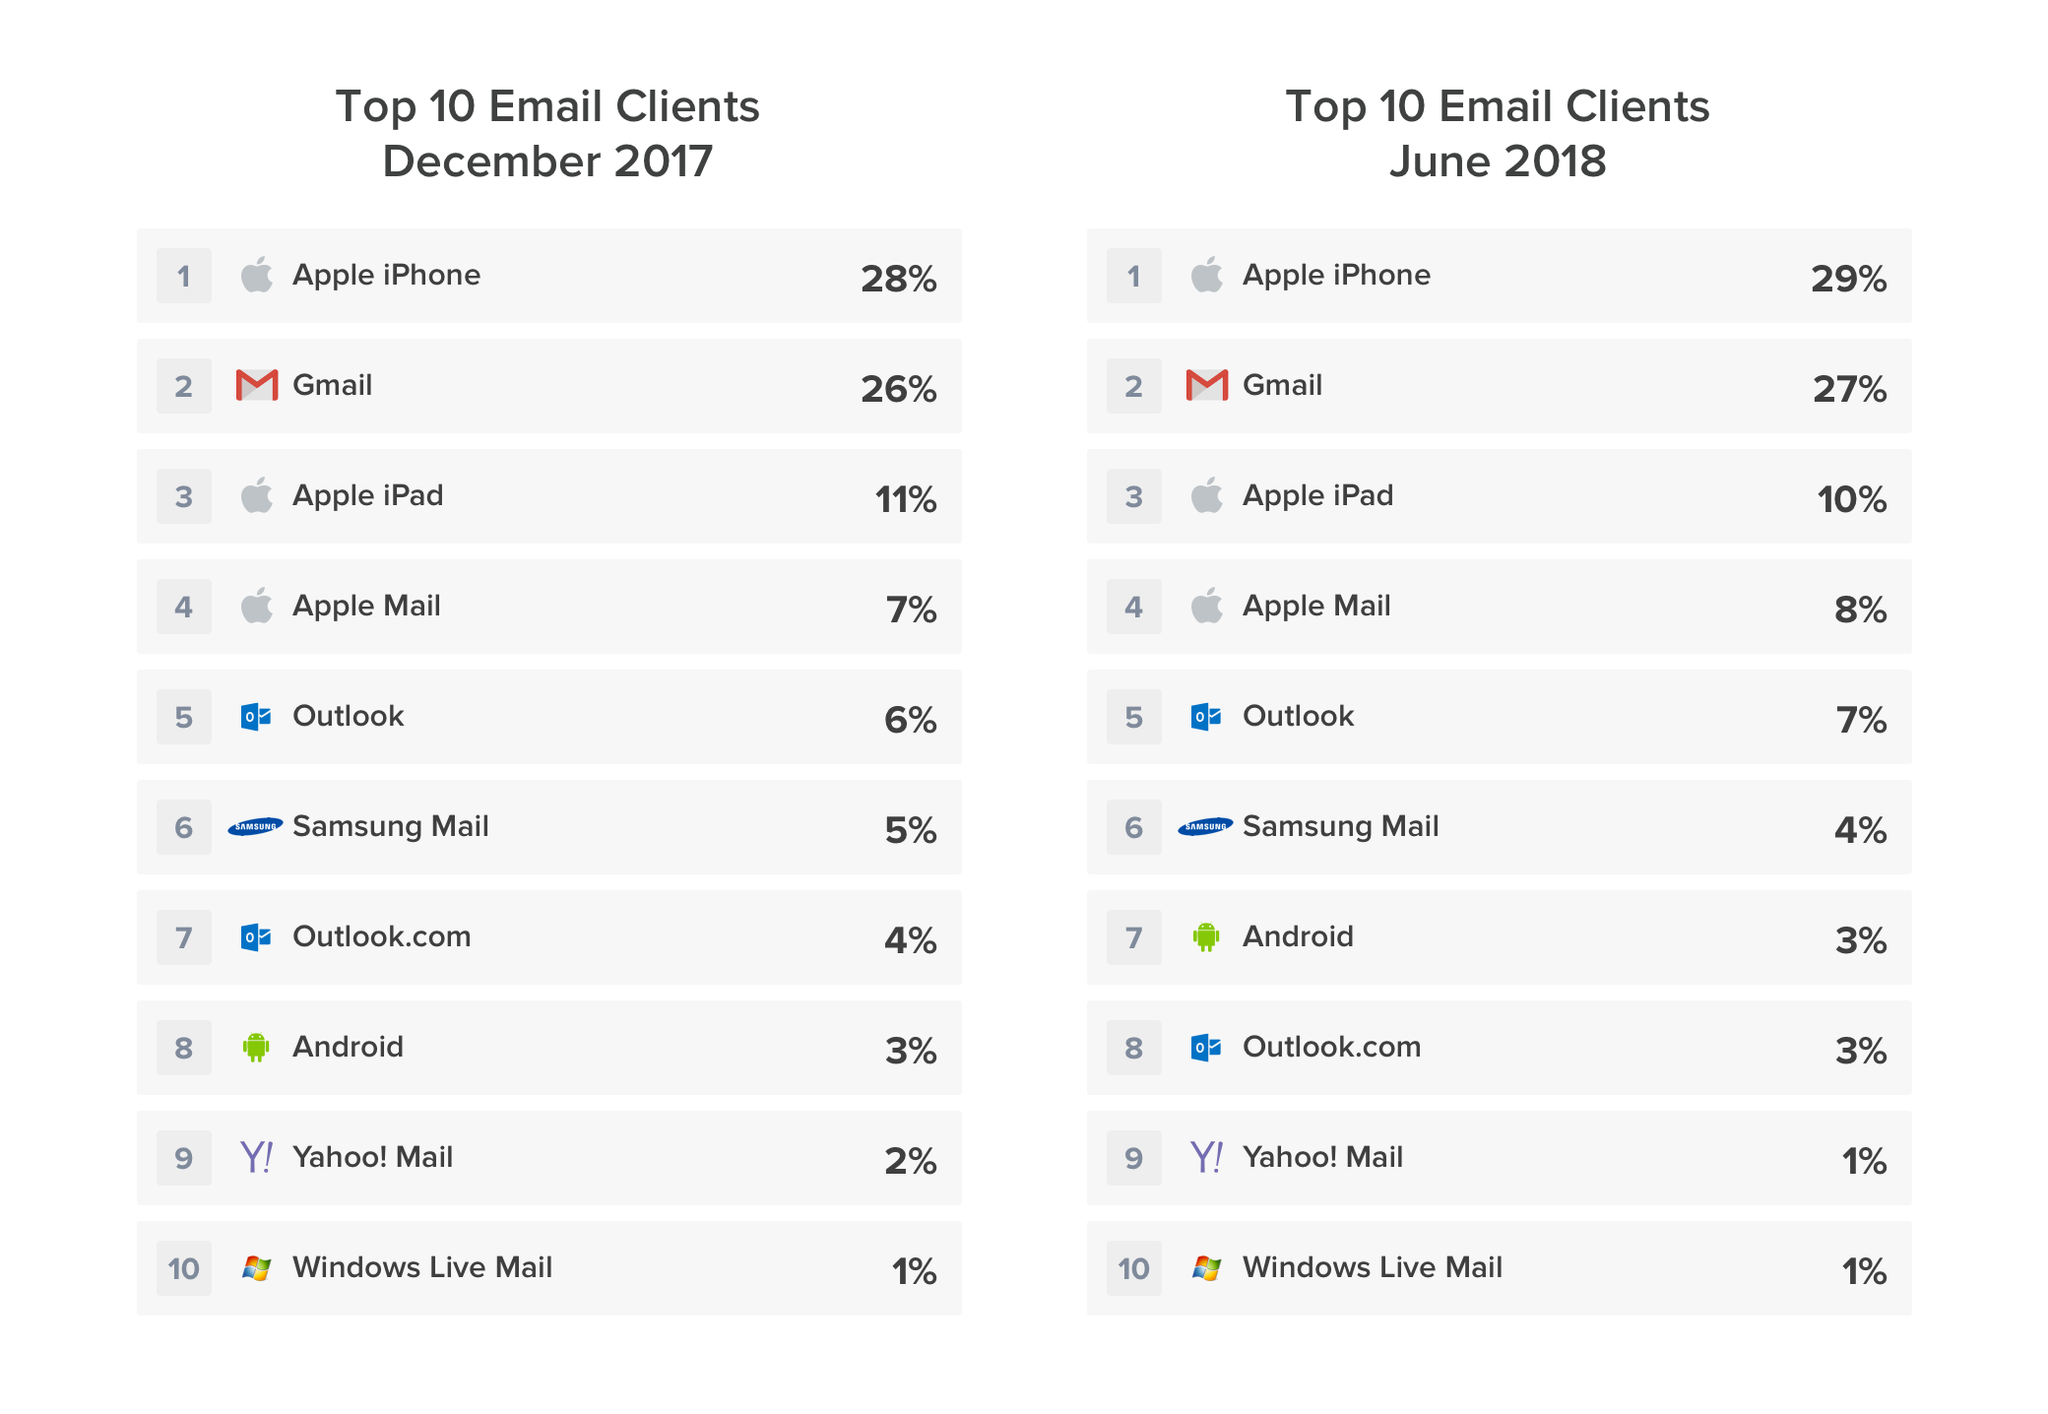
The first half of 2018 didn’t bring any significant movement to the top 10 most popular email clients. While there have been a few small changes in market share—for example, Apple iPhone and Gmail have both gained one percentage point while Apple’s iPad has lost one percentage point—the overall ranking has remained virtually unchanged with the exception of spots 7 and 8. Outlook.com, which was the 7th most popular email client in December 2017, has lost one percentage point in market share, causing it to drop below Android, which now holds the #7 spot.
Overall, there were no major surprises on the top 10 list. This also means that…
Most emails continue to be read on iPhones and in Gmail
Apple’s iPhone (29%) and Gmail (27%) remain the the most popular environments to read email. With a combined market share of 56%, the majority of all emails are read in one of these clients.
While Gmail opens did see a dip in February and March 2018, the past three months have shown a steady rise in Gmail opens. The timing of the climb in opens matches the relaunch of Gmail’s new interface, which started rolling out in April. Does the new and improved Gmail—which is still optional for users at this point—already have a positive impact on reading behavior? We can only hypothesize.
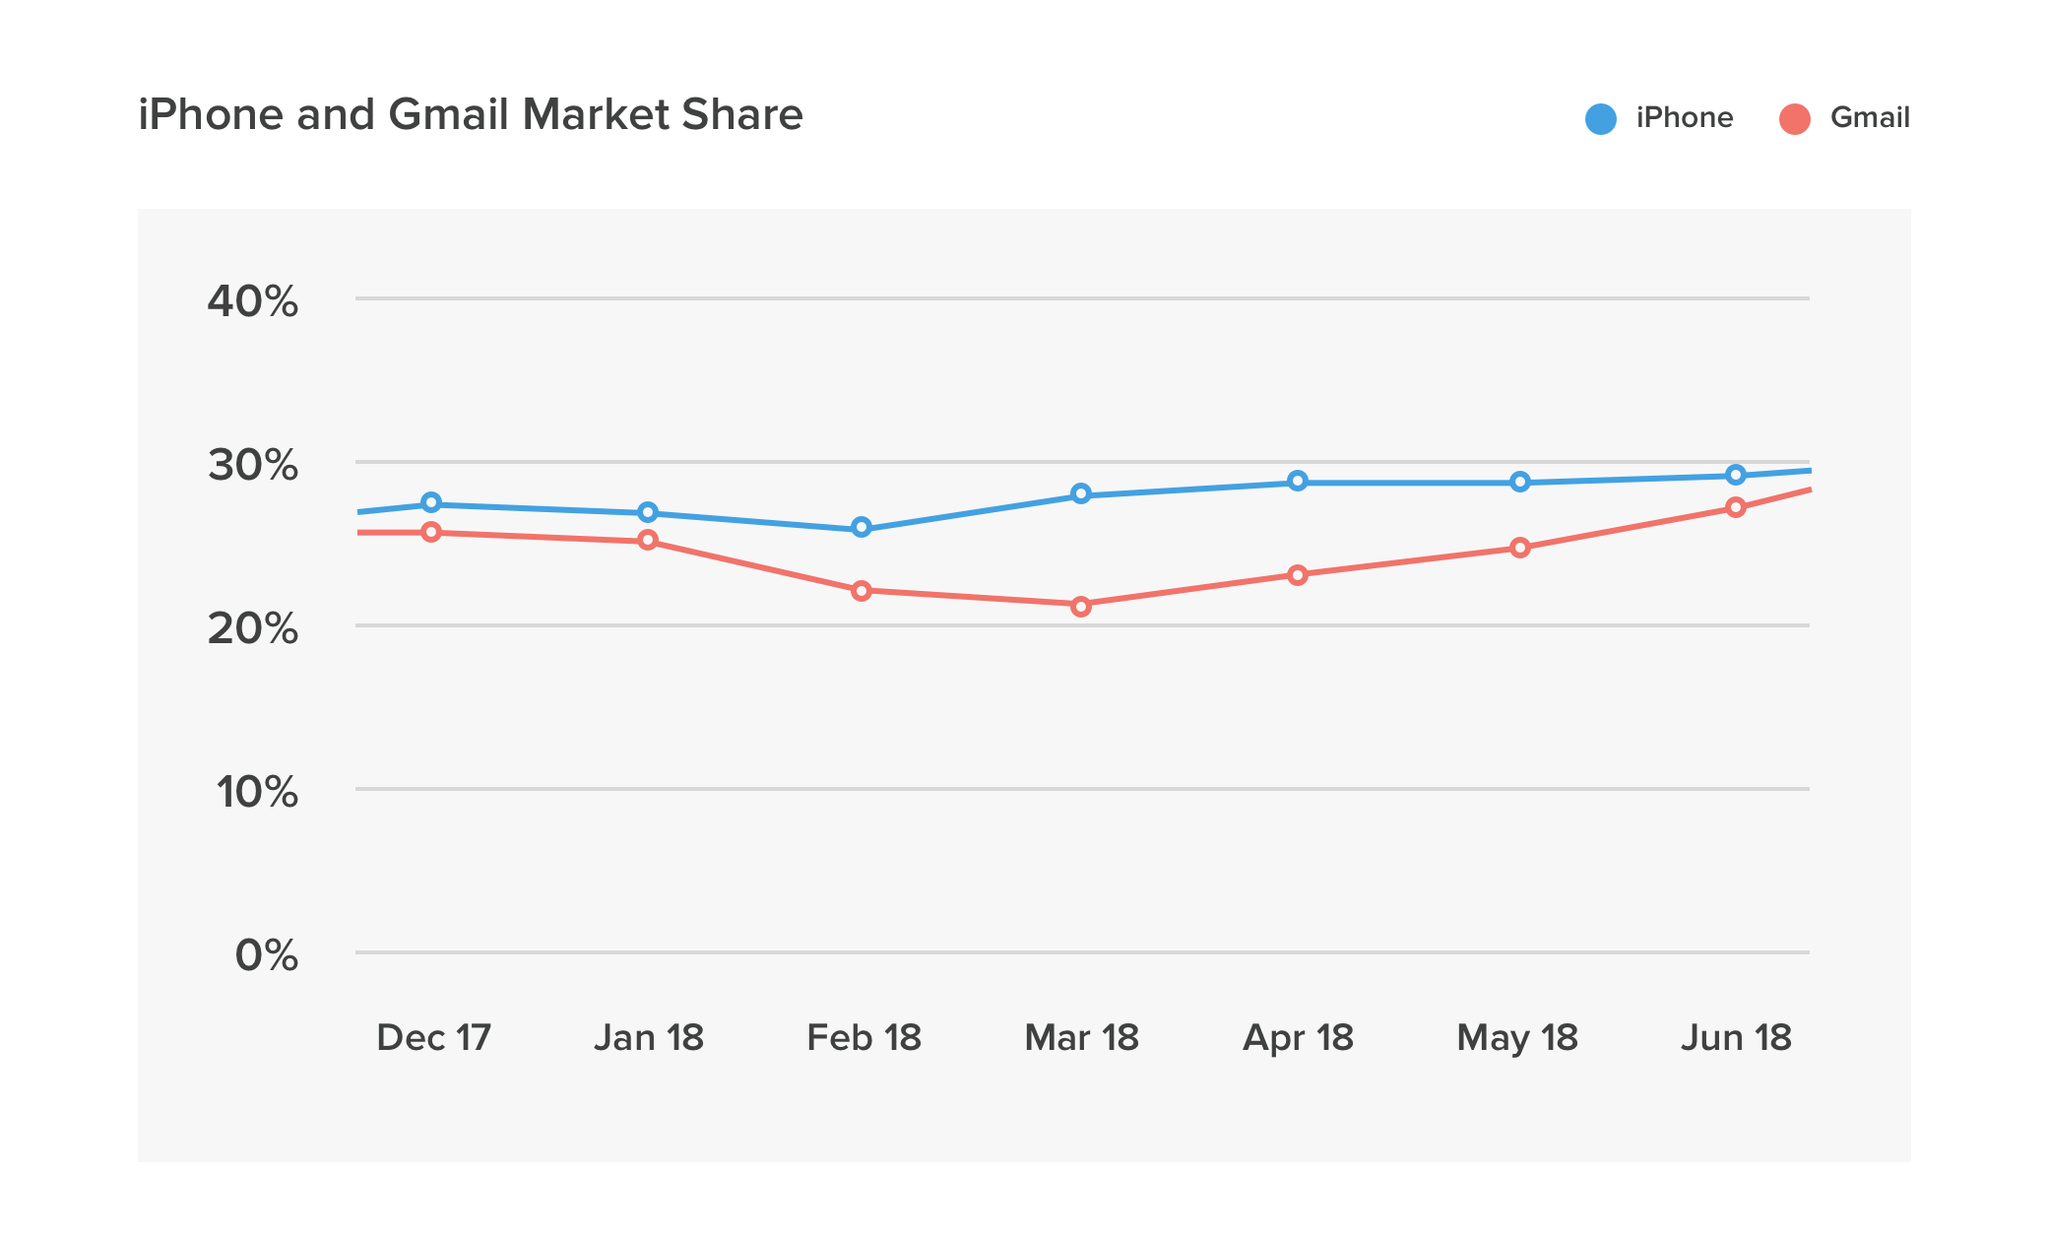
What’s clear though is that if Gmail opens continue to grow at this rate, there is a chance that Google’s popular email client might have a chance to take over the number one spot on the market share leaderboard from Apple’s iPhone before the end of the year.
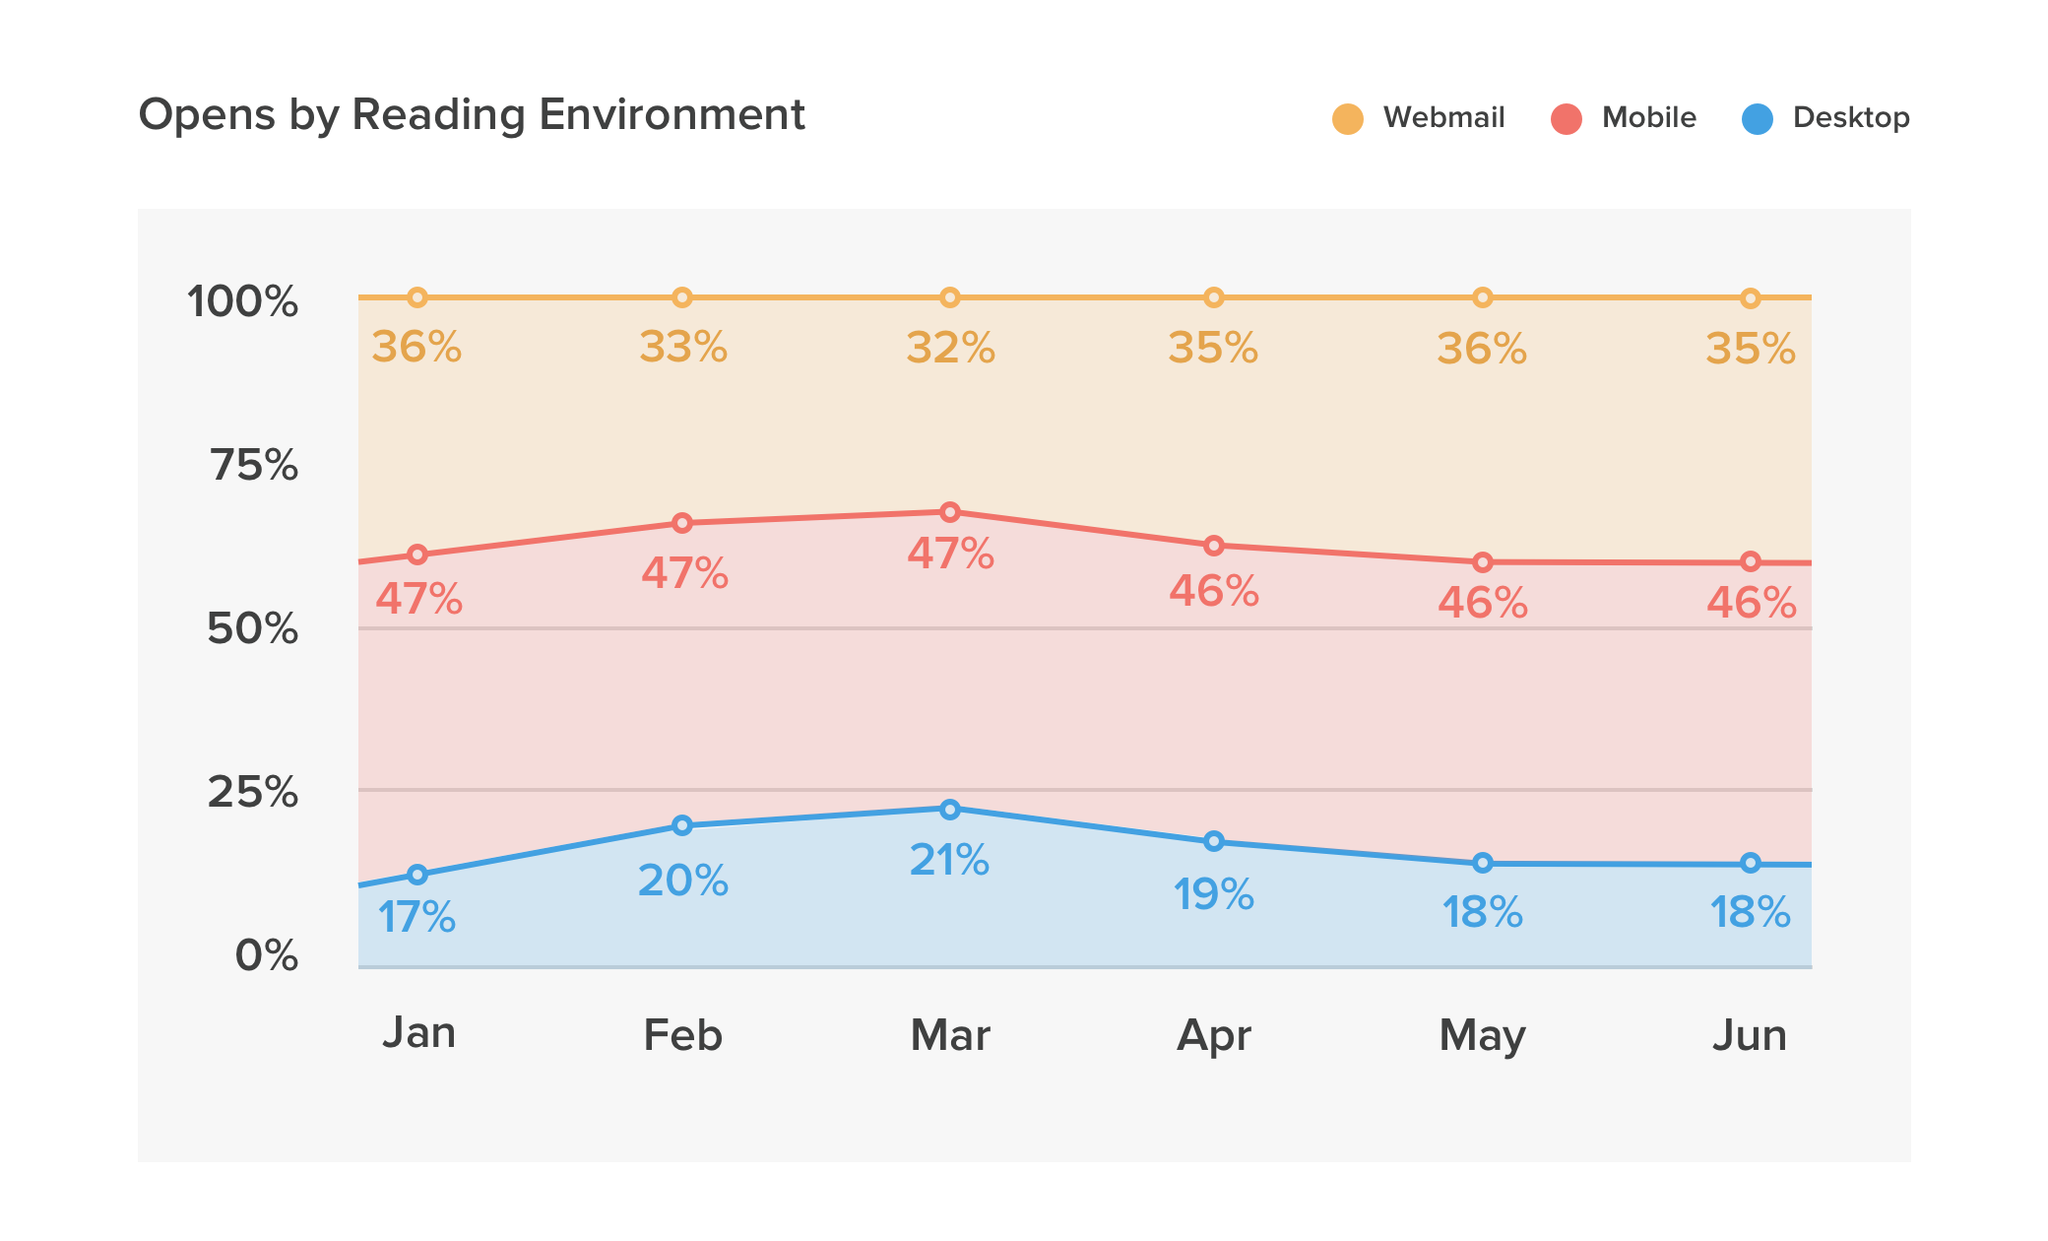
Mobile remains the most popular reading environment
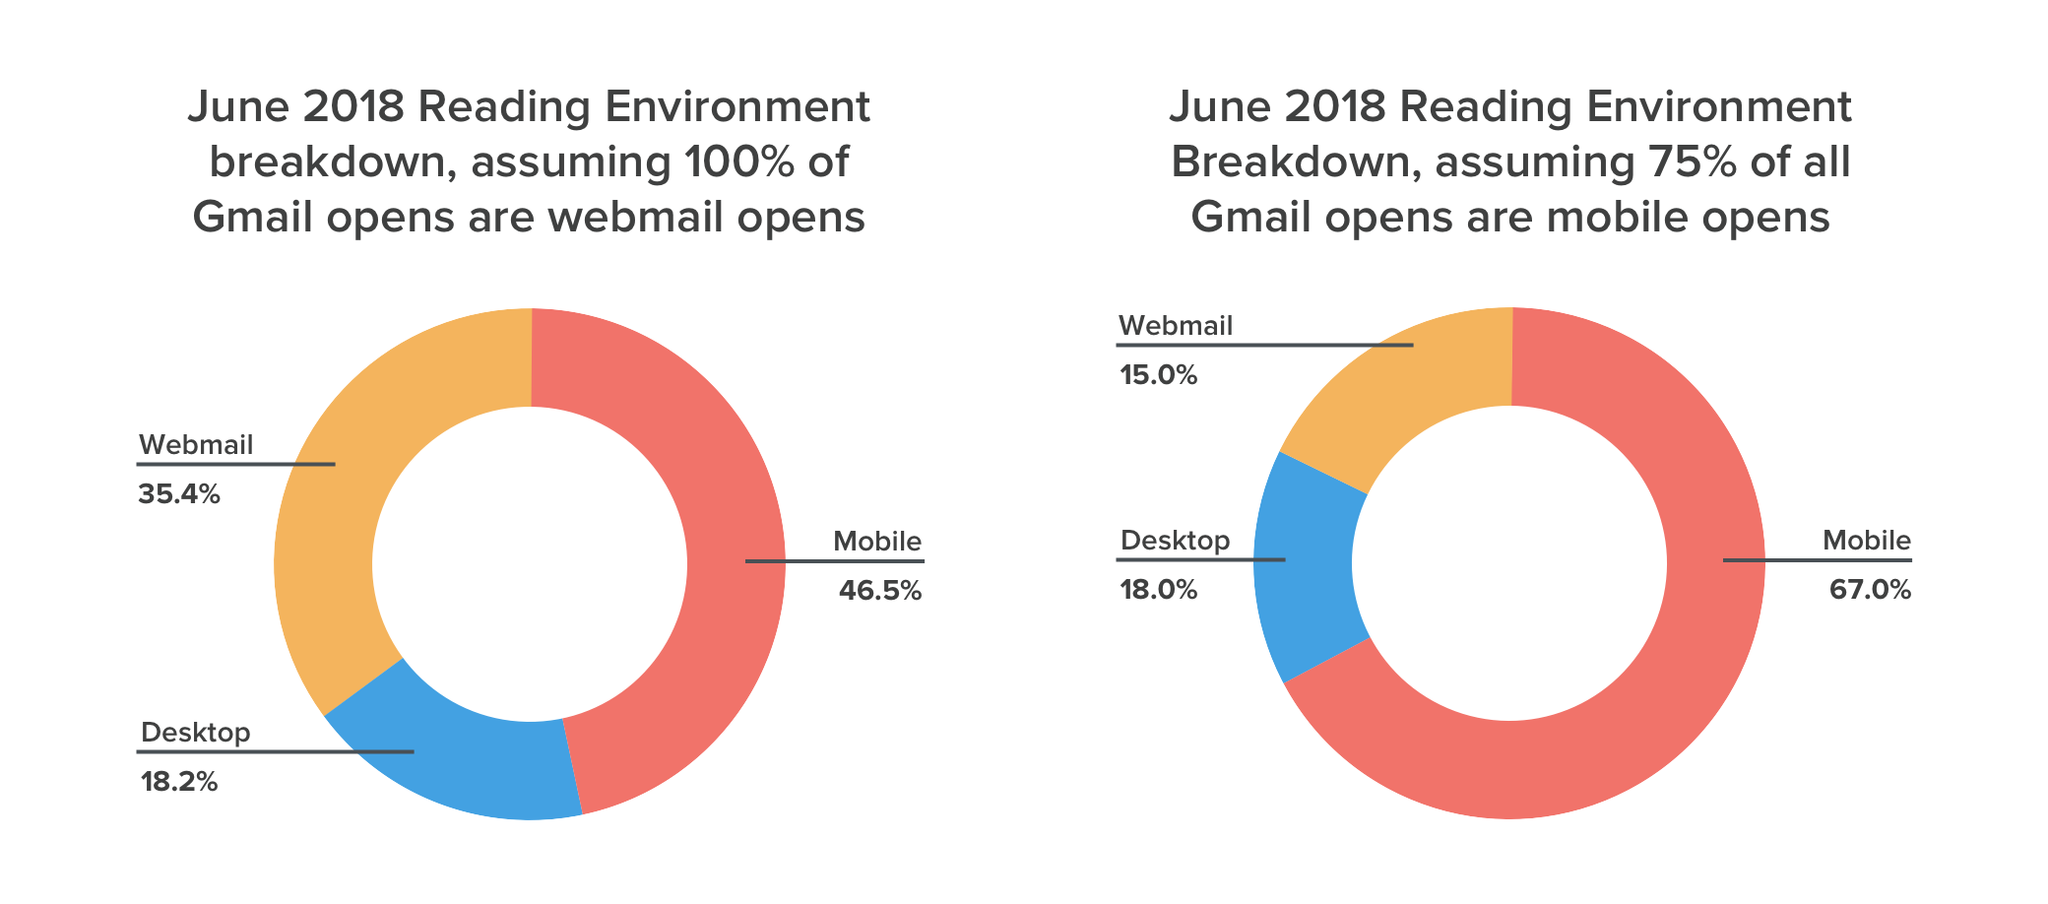
When looking at email opens by reading environment, we didn’t see any major movements in the first half of 2018. Aside from a little bit of fluctuation in the first quarter (desktop opens rose to a peak of 21% in March while webmail opens dropped to 32%) the first half of 2018 ended close to where it started. In June 2018, mobile opens accounted for 46% of all email opens (down 1% from December 2017), followed by webmail opens at 35% (-1%), and desktop opens at 18% (+1%).
Why mobile opens might be even higher
While the Email Client Market Share data clearly shows the dominance of mobile reading environments, the share of mobile opens might in fact be even higher than the data shows. That’s because of Gmail’s image caching, and the limitations it brings to email analytics data.
Gmail automatically downloads and caches images. Those cached images—including open tracker pixels, like the ones email platforms and Litmus uses to collect data—are stored on Gmail’s servers. Gmail then loads the same images from the same servers each time a subscriber opens the email—regardless of whether that open happens in a web browser or inside the Gmail app for Android, iPhone, or iPad. This means that an email opened in Gmail via a web browser will be indistinguishable from an email opened in the Gmail mobile app. Due to the historical precedent of Gmail as a primarily web-based email client, Gmail opens are reported as webmail opens.
Google has claimed that about 75% of all Gmail users access their email on mobile devices. So what if we used that number to adjust our market share breakdown?
Gmail accounts for 27% of all email opens—all of which currently count towards webmail opens. If we assumed that three quarters of these opens are mobile opens, and only one quarter are webmail opens, the breakdown of reading environments for June 2018 would change significantly. Mobile opens would rise to 67%, and webmail opens would decrease to 15%.
 |
Estimate your own Gmail mobile opensUse Litmus Email Analytics to find out how many of your subscribers open in Gmail, get your average mobile open rate in other clients, and then use those insights to estimate opens in Gmail’s mobile apps. |
The Android market continues to be heavily fragmented
The heavy fragmentation of the Android market has always been a pain for email marketers. While Apple’s iOS enjoys high adoption rates as soon as Apple releases a new version, Android doesn’t. Many older Android devices are not eligible to upgrade to newer OS releases, leading to massive fragmentation of Android—a trend we see in our email client market share data as well.
Less than 30% of all emails are opened on an Android device that runs Android’s most recent version (Android Oreo or Android 8.x, which was released in August 2017). Android Nougat (released in 2016) still holds the largest share of Android opens with 40%, and Android Marshmallow, released almost three years ago in October 2015, accounts for 16% of all Android opens. The remainder of the Android pie—a significant 14% of the market—are opened on devices that run on Android versions that are even older than that. Compare that to the iOS world, where the most recent operating system—iOS 11—accounts for three quarters of all emails opened on iPhones and iPads.
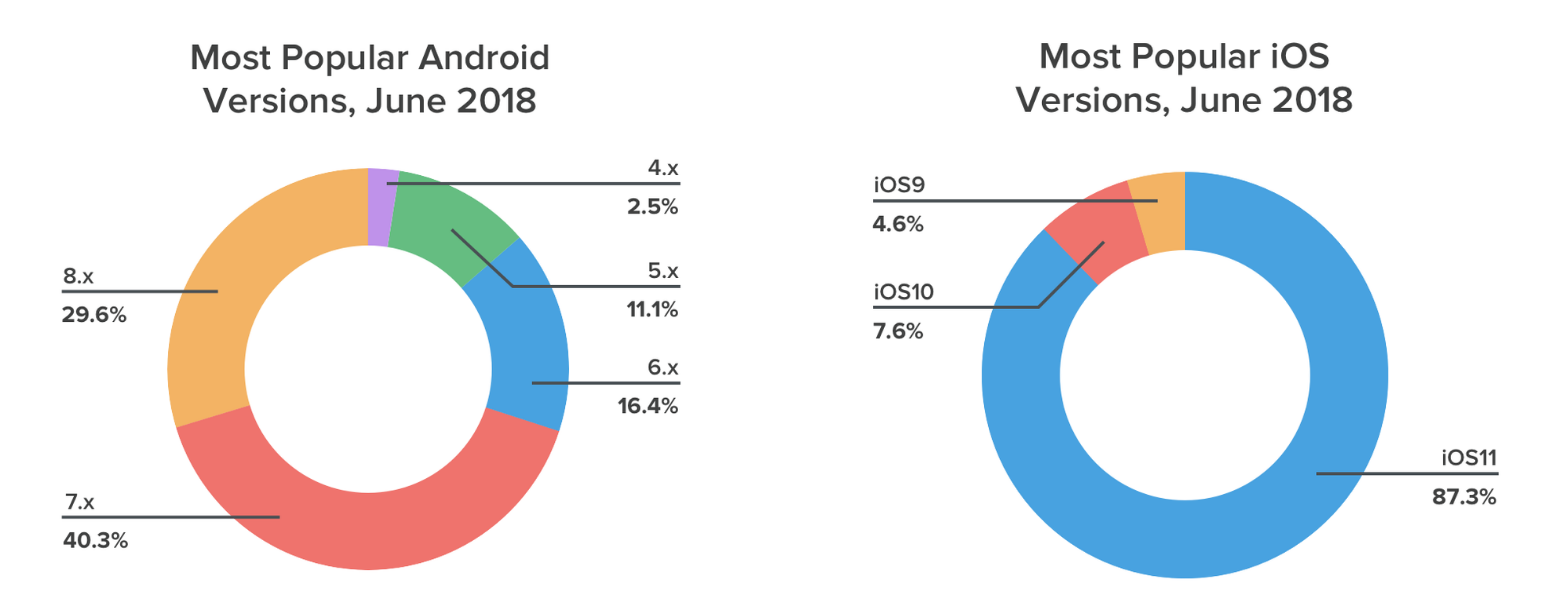
Email marketers who send to an iOS-heavy audience can easily focus their testing and optimization efforts on Apple’s two most recent operating systems (iOS 11 and iOS 10 have a combined market share of more than 95%). Marketers with predominantly Android-leaning mobile readers, however, will have to continue testing their emails across a broad range of Android versions to ensure a great reading experience for all mobile subscribers.
 |
Streamline your email testing with Litmus Email PreviewsSee screenshots of your emails across 90+ apps and devices to ensure compatibility in all environments. |
WHERE DID WE GET ALL THIS DATA?
This data is derived from over 6 billion opens collected worldwide with Litmus Email Analytics between January 1, 2018 and June 30, 2018. It highlights worldwide trends across all industries and verticals. Some email clients may be over- or under-represented due to image blocking.
WHICH EMAIL CLIENTS ARE MOST POPULAR WITH YOUR AUDIENCE?
While general email client open data is great for looking at trends, it’s your audience that matters. With the addition of a small tracking code to your campaigns, Litmus Email Analytics generates a report of where your subscribers open your emails. Use that data to focus your testing efforts—and ensure your campaigns look great in inboxes where your subscribers are opening.
The post Email Client Market Share Trends for the First Half of 2018 appeared first on Litmus Software, Inc..
![]()