
Most marketers rely heavily on two basic metrics when looking at their email reporting: Open and clickthrough rates. While open and clickthrough rates are a great way to see which subject lines and preview text are getting the most opens and which links are getting the most clicks, they don’t provide a deeper understanding of subscriber interactions—and therefore they can also only provide a limited picture of your campaign’s performance.
In addition, most marketers use analytics data only to judge whether or not their campaigns are successful or not. With that, however, they’re missing out on what might be the most powerful aspect of email analytics: Using data to better understand their audience. Email analytics that go beyond opens and clicks can help you paint a more complete picture of your subscriber base and how they engage with your message, providing you with more opportunities to improve your campaigns, and send more targeted messages.
Ready to lift your email reporting to the next level? Here are five metrics you should add to learn more about the people who are receiving your emails and how to get more thorough insights on your email campaign’s success.
1. Engagement times: How much time do subscribers spend engaging with your message?
Keeping track of engagement times can help you get insights on how your subscribers interact with your email after they open and before they click (if they ever click). Do your subscribers just skim your email, or do they spend more time reading it?
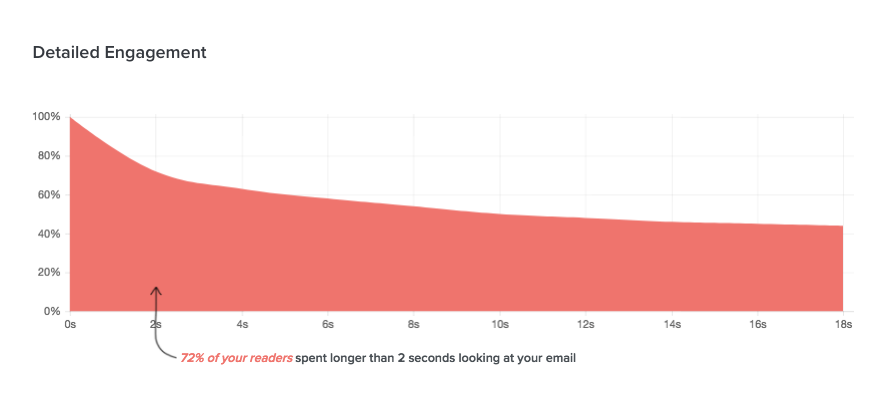 Detailed engagement data in Litmus Email Analytics
Couple engagement metrics with open and click data provided by your ESP and you can create a holistic picture of your emails performance and get insights on how to improve your campaigns. For example, if you see high engagement times—your subscribers spend a long time reading and exploring your message—but see low click rates, this can mean that your subscribers have trouble finding the CTA. If you see high open rates but low engagement times and low clickthrough rates that might mean that your subject line triggers your subscribers’ interest, but your content doesn’t match their expectations so they abandon your email quickly and never click through.
2. Device and email client usage: What tools do your subscribers use to read your message?
On the highest level, you can use device data to identify what percentage of your audience reads your email on mobile, compared to opening your emails on desktop or webmail. That not only helps you make design decisions on whether or not you need to optimize your emails for mobile audiences—by using responsive or hybrid design approaches, for example—but can also help you send more targeted messages. Does a large share of your subscribers open your messages on iPhones? Consider promoting your iPhone app on the next send.
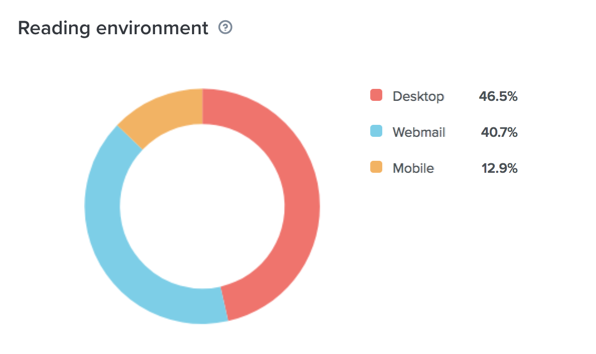 Reading environment breakdown in Litmus Email Analytics
On a deeper level, you can look at what email clients your audience uses. The email world is characterized by inconsistent HTML and CSS support across clients, so understanding your audiences’ most frequently used clients can help you make more educated design decisions. Have you been playing with the idea of trying a new interactive technique that’s only supported in a limited number of email clients? Knowing which email clients are popular with your audience is the first step to deciding whether investing in more advanced coding techniques is worth it.
3. Geolocation: Where in the world do your subscribers open?
Geolocation tracking provides insights into where your subscribers are when they read your emails and allows you to make more informed decisions for future campaigns. Knowing where your subscribers are based can help you:
- Optimize send times
While we don’t believe there is a “perfect time” to send an email, you can use geolocation data for send time optimization. If the majority of your subscribers are in Asia, then it probably makes sense to send when they are awake and actually checking email—or to segment your list and send targeted emails based on your audience’s time zone. - Prepare for international email law compliance
With tighter anti-spam rules across the globe it’s more important than ever to understand where your audience is based. Understanding whether or not you have subscribers in the European Union, for example, will help you understand whether or not you’ll have to comply with GDPR, Europe’s new privacy law that’s coming into force in 2018. - Inform copywriting and customize content based on location data
A breakdown of your audience by location can help you understand what content performs best for subscribers from different regions. Plus, it can help you to segment your list and include dynamic, region-specific content—like information on local events—to better personalize your messages for your audience.
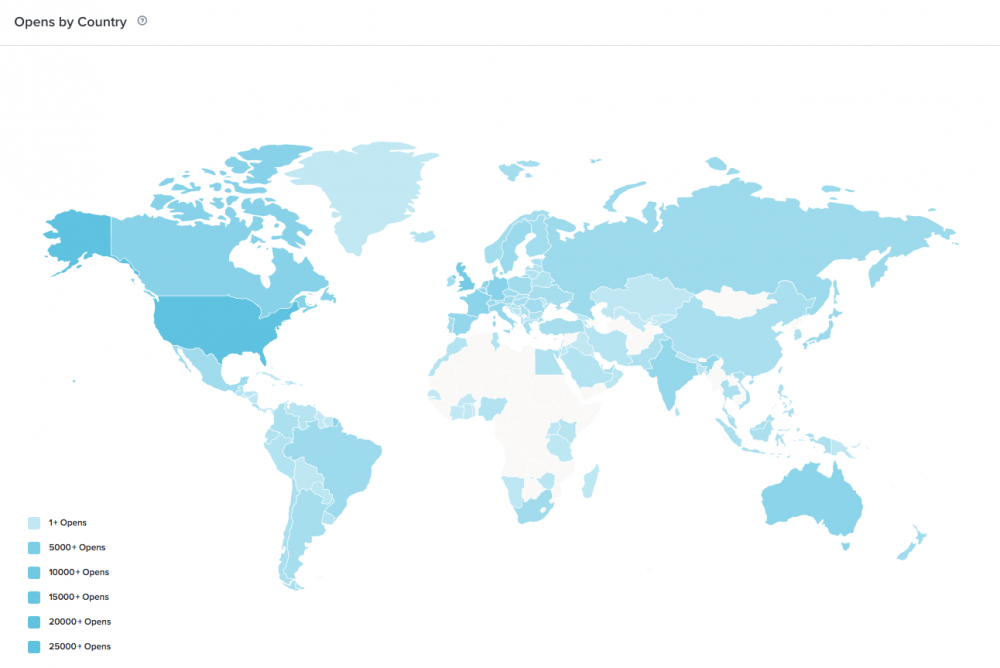
Geolocation data in Litmus Email Analytics
4. Email Forwards: How often do your subscribers hit the forward button?
You’re spending lots of time optimizing your emails for your subscribers—and sometimes your subscribers might help you spread the word by forwarding your message to their friends, family or coworkers.
Forwards expand the reach of your messages and generate additional conversions, but they have significant meaning beyond that. Forwards are a powerful indication of the overall health of your email program, because they are a sign that you’re fulfilling your subscribers’ needs at the highest level: You’re not only creating emails that are valuable for your subscribers, but for their network, too.
Plus, by looking at who the subscribers are that forward your emails, you can identify the true influencers within your subscriber list—and then use that data to send targeted emails to your most valuable subscribers.
5. Measuring Prints: How often did subscribers print your email?
While not relevant to everyone, some brands can benefit from tracking how often an email was printed.
For example, imagine an email that includes a coupon that needs to be printed and brought to a local store to be used. Measuring this email’s success by clickthrough rates wouldn’t be fair, since it’s goal isn’t to generate website visits. This email is successful if a large percentage of your audience prints the email (and hopefully redeems the coupon at the brand’s store). Measuring the number of times an email was printed helps you better understand the effectiveness of this coupon campaign and email’s contribution to it.
Understanding printing behavior can be relevant for emails that contain:
- Coupon codes or vouchers
- Booking confirmations
- Tickets for travel or events
Get to know your audience with Litmus Email Analytics
Litmus Email Analytics helps you learn more about your audience so you can create targeted, high-performing emails. With advanced insights from Litmus Email Analytics you can discover which email clients are popular with your audience to fine-tune testing and optimization efforts, and use engagement and geographic data to inform design, send time, segmentation, and copywriting decisions.
Need help getting started?
It doesn’t matter if you’re already a Litmus customer or just want to give Email Analytics a try—we’re here to help you get started. Just send an email to hello@litmus.com and we’ll help you set up Email Analytics for your next campaign
The post The 5 Metrics You Should Add to Your Email Reporting appeared first on Litmus Software, Inc..